Player Metrics 2: Metric Boogaloo
Last year around this time, I posted graphs drawn from player data recorded at PAX South 2015. That data was super useful for seeing how new players did with various sports their first time or two playing. Well, I’m back from PAX South 2016 and I have more player data from the hundreds of games played over the weekend by attendees. Let’s get to it!
Similar to last year, I had to combine all my CSV files and eliminate all the AI players to get pure human data. This left 1595 100% human players. I went back to Datacopia for graphs. It’s a great site, but you have to really cut down your data to just what you are interested in seeing. Otherwise, it creates a ton of random combinations of data, and I was having trouble sifting through and finding useful ones.
The other thing I needed to do was use Google Sheets to total up the data by player type, and then get the average for each player type. Finally, I could create a spreadsheet with the averaged data by player type to graph with and export as CSVs.
Before I start, I should mention the data got recorded with the internal names for the characters, so Rollergirl == Roller Derby, Hockeyman == Hockey, Eggman == American Football, Soccerman == Soccer, Basketman == Basketball, and Batsman == Baseball. So without further ado, the graphs!
First off, this shows which players were most and least popular at PAX South:
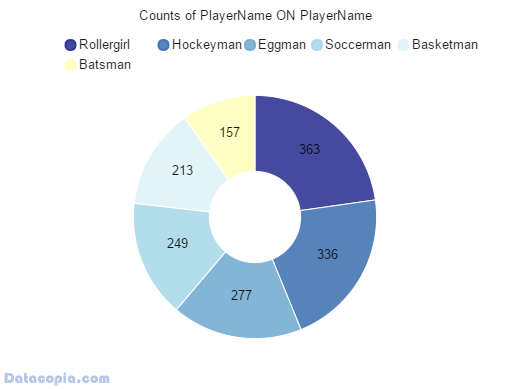
Roller Derby took the lead, with basketball and baseball players being the least popular. Baseball in particular was not a popular choice for new players.
The next data is ball carry time, ie: how long players held the ball.
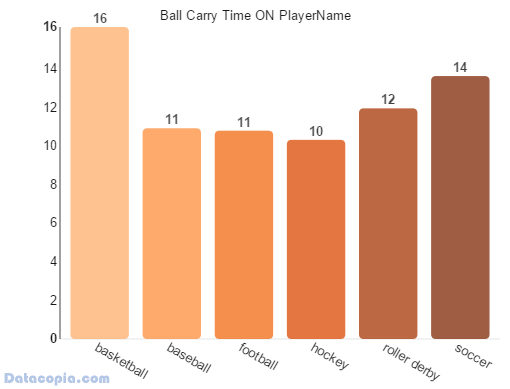
Basketball and soccer players hold the ball more than other players on average. This isn’t too surprising, as they can steal the ball, and they are the fastest players. Thus, they are more likely to be holding onto the ball than other players. The basketball player in particular has an edge because of his “Fast Break Steal” ability, which gives him a temporary speed boost after stealing the ball.
Slam Dunks:
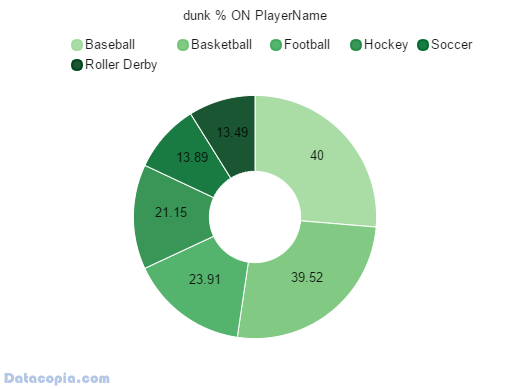
Speaking of the basketball player, you would think he would be the best dunker, but he was inched out by the baseball player. The basketball player has a much larger dunk window, but it is later in the animation sequence, so new players were probably getting too excited and hitting dunk early with him. I’m surprised roller derby had so few dunks, she’s pretty easy to dunk with, but looking at the data, I see a lot of players who only dunked once, and missed that dunk, vs. a larger percentage of basketball players attempting more than one dunk, and sinking one. One think to keep in mind with the dunk data is how many dunk attempts were made — some players never got the chance. Here are the totals:
| player | dunks attempted |
| basketball | 35 |
| baseball | 10 |
| football | 23 |
| hockey | 26 |
| roller derby | 42 |
| soccer | 18 |
With only 10 baseball dunks attempted, it’s hard to read too much into the data. But there’s more ways to score, let’s check ’em out.
Shots scored means the average number of successful shots per player:
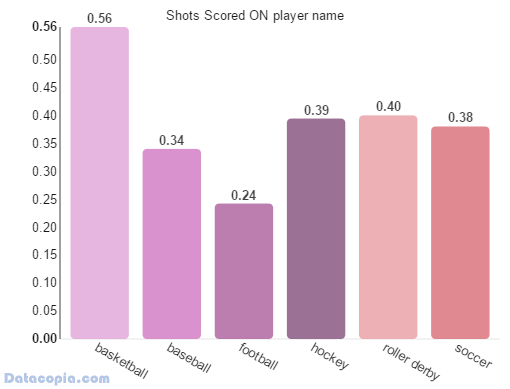
Basketball did very well, as he can shoot for the hoop and sometimes shots bounce in through the field goal.
Not all shots score however:
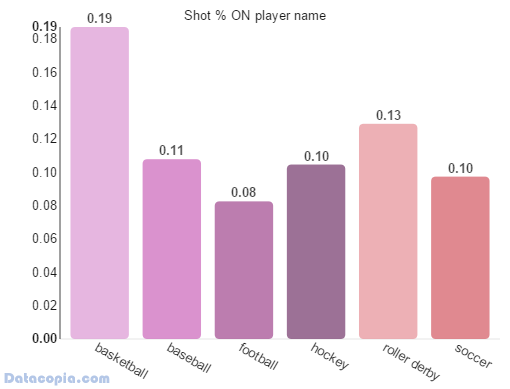
Basketball also got the best percentage of shots going in, with American football in last again. But what about actual points? That’s what wins a match, after all.
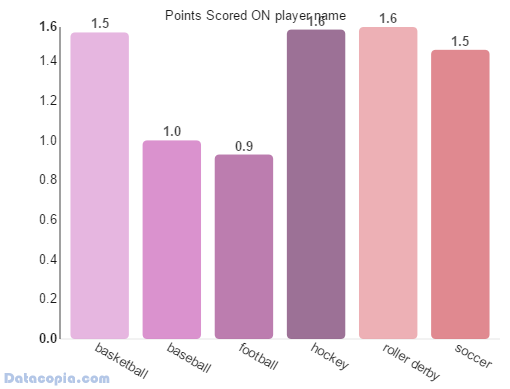
More shots doesn’t always mean more points; the lower net is worth 4 points in the default Quick Match game, with the hoop worth 3 and the field goal worth only 2. Basketball still does very well, but here we can see hockey, roller derby and soccer doing about equally. The oddball baseball player and the american football players are still lagging. I believe with practice, the baseball player can be a very powerful teammate, and I would bet American football would do a lot better in the hands of a skilled player as well. Keep in mind over 1500 people played the game at PAX South, many of whom had never even heard of it before. It is still useful data though; I can stop recommending American football as a beginner character, and should probably push more new players into basketball.
Now let’s break down the scores by the different goal types. First up, the hoops:
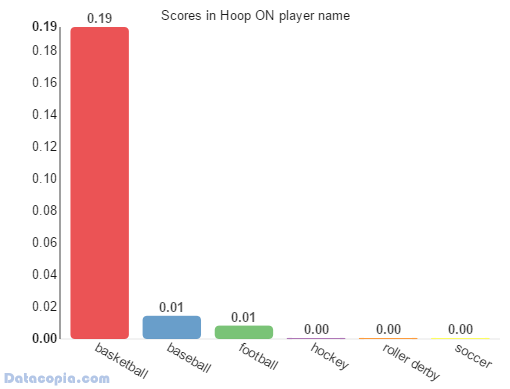
What??? Basketball players are good at baskets? THIS DATA IS CRAZY!
On to field goals:
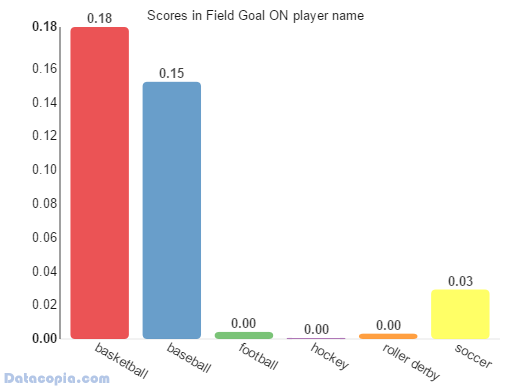
While basketball is in the lead here, baseball is definitely a good field goal choice — and these were from players who didn’t do very well with him. A few soccer players managed to charge up enough to kick a field goal as well.
The lower net is the big points-maker:
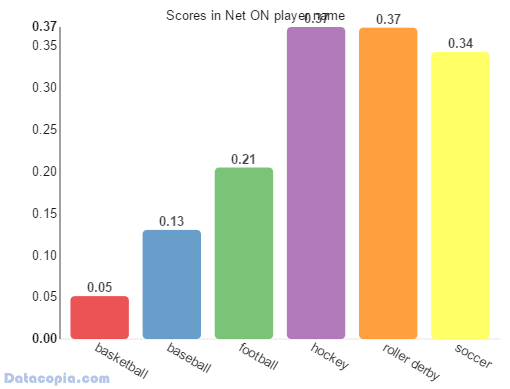
Here’s where hockey, roller derby and soccer catch up. A good use of turbo would help American football, but again, these were first time players.
And here’s the data all put together:
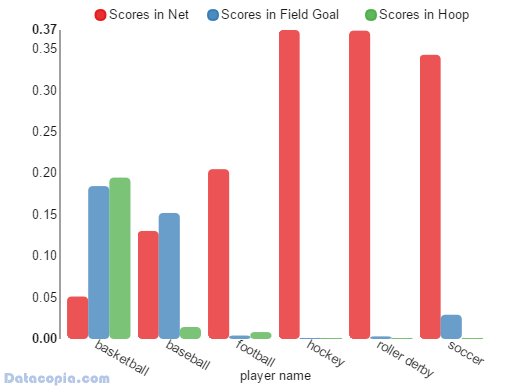
What about fighting?
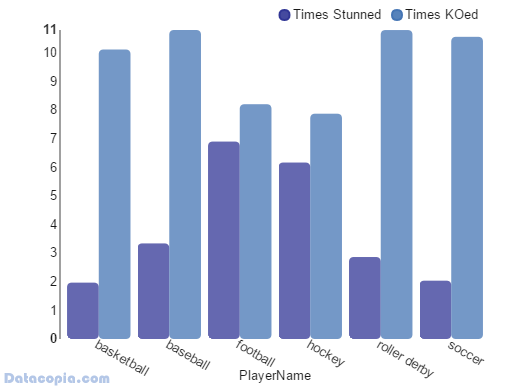
Players have HP and Strength stats, so an American Football player takes a lot of damage before getting KOed and can take out anyone in one tackle for example. Soccer and basketball players have the lowest HP, but derby and baseball got KOed a bit more. It isn’t very clear why unless you look at this chart of attack points (AP) vs. hit points (HP):
| Hits to KO | ||||||
| basketball: 2 HP | baseball: 3 HP | football: 5 HP | hockey: 4 HP | roller derby: 3 HP | soccer: 2 HP | |
| basketball: 1 AP | 2 | 3 | 5 | 4 | 3 | 2 |
| baseball: 2 AP | 1 | 2 | 3 | 2 | 2 | 1 |
| football: KO | 1 | 1 | 1 | 1 | 1 | 1 |
| hockey: 3 AP | 1 | 1 | 2 | 2 | 1 | 1 |
| roller derby: 3 AP | 1 | 1 | 2 | 2 | 1 | 1 |
| soccer: 1 AP | 2 | 3 | 5 | 4 | 3 | 2 |
You can see that roller derby and baseball players can be KOed in one hit by 3 player types. Basketball and soccer can be KOed in 1 hit by 4 player types, but their high speed probably helps them avoid getting hit as much. Meanwhile, American football can KO anyone in one hit — very useful in spite of his scoring stats.
Conclusions:
The game seems pretty well balanced from this data. The low speed of the American football player and the oddball shot style of the baseball player makes them poor choices for new players, but I would argue they are powerful players if you learn them. I would need to see experienced player data to get a better sense of these players in the right hands.